\(\newcommand{\AA}{\unicode{x212B}}\)
5.3. Pre-edge subtraction and Normalization
As shown above in Figure 5.1.1.1, the main analysis panel for
the Larix program is the “XAS Normalization” Panel. This panel helps
you do pre-edge subtraction and normalization of XAFS data using the
find_e0(), pre_edge(), or mback_norm() functions. This
processing step is important for getting normalized XAFS spectra that is
used for further analysis of both XANES and EXAFS. In general, the idea is
to get the main step of each XAS spectrum to go from 0 below the main edge
to 1 above the edge, so that the normalized spectrum represents the average
absorption of each absorbing element in the sample.
The first step in the process is to identify \(E_0\), the absorption threshold energy. This is typically (and by default) chosen as the energy point where the first derivative \(d\mu(E)/dE\) has a maximum. This may not necessarily reflect the onset of absorption or the Fermi level, but it is easy to identify reliably for any spectrum. At this point, the value does not have to be highly accurate, so that predictability and reproducibility are favored. You can set the value of \(E_0\) or allow it to be determined automatically.
The next step is to measure how large the jump in absorption is. This
process can be somewhat trickier, so that there are some heuristics built
in to Larix (and pre_edge()) to help make this more robust.
You can explicitly set the the value of the edge step, or allow it to be
calculated from the spectra in one of two ways.
The classic way for determining the edge step is encapsulated in the
pre_edge() function. Default values for ranges for the fitted
pre-edge line and post-edge normalization curve can be set, or you can rely
on the default settings for these values. In general, the default settings
give pretty good results, but the value for the edge step or the fitting
ranges and curve forms can be altered here.
Consult with pre_edge() and mback_norm() function for more
details on these parameters. Note that you can copy processing parameters
from one group to other groups with the set of “copy” buttons that will
copy the corresponding parameters to all the selected groups.
Finally, from the normalization panel, you can plot the data for the one currently selected group or for all selected groups in a few different ways: Raw \(\mu(E)\), normalized \(\mu(E)\), the derivative \(d\mu(E)/dE\), flattened \(\mu(E)\). For the current group there are even mor options, including the raw \(\mu(E)\) with the pre-edge line and post-edge normalization curve, or compare with the MBACK-calculation for normalization.
5.4. Common XAS Processing Dialogs
When importing and normalizing XAS data, it is sometimes necessary to make some corrections of manipulate the data in a few well-defined ways. These can include:
copying, removing, and renaming data groups.
merging of data groups – summing similar or repeated spectra.
de-glitching spectra.
recalibrating or aligning spectra.
smoothing of noisy spectra.
re-binning of spectra onto a “normal” XAFS energy grid.
de-convolving spectra.
correcting over-absorption in fluorescence XANES spectra.
There are several dialogs available in Larix, each designed to guide through the steps needs for these corrections or manipulations. Each of these is described in more detail below.
5.4.1. Energy Calibration and alignment
Each XAS spectra Group has
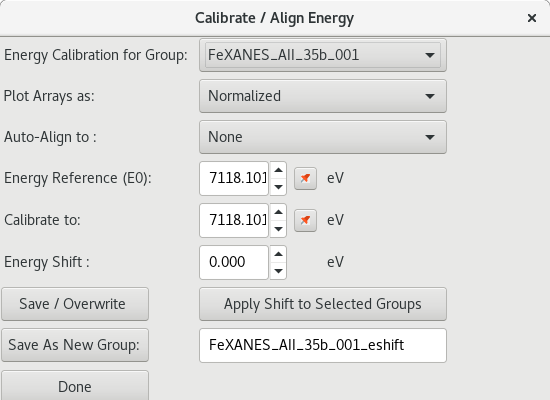
Figure 5.4.1.1 Energy calibration dialog.
5.4.2. Deglitching and Truncating Data
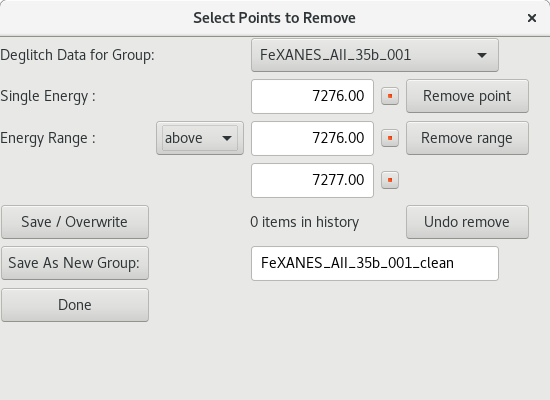
Figure 5.4.2.1 De-glitching dialog
5.4.3. Smoothing Data
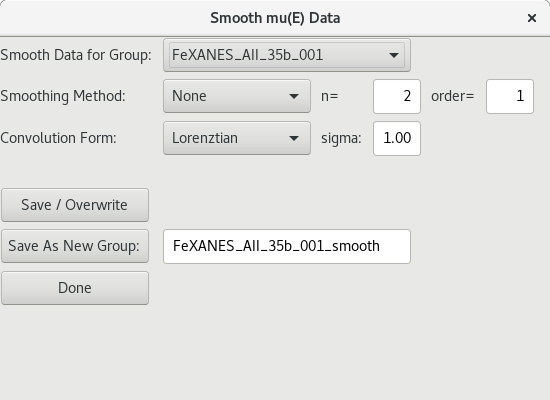
Figure 5.4.3.1 Energy smoothing dialog.
5.4.4. De-convolving XAS Data
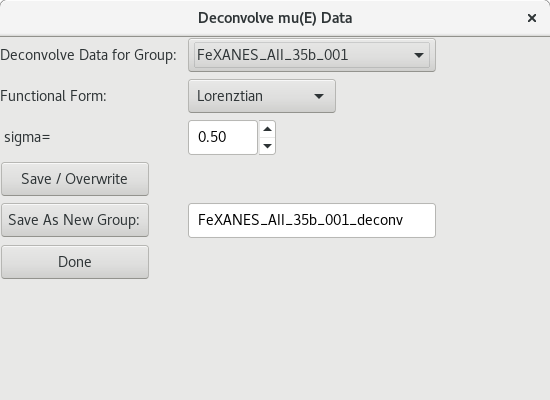
Figure 5.4.4.1 Deconvolution dialog.
5.4.5. Re-binning XAS Data
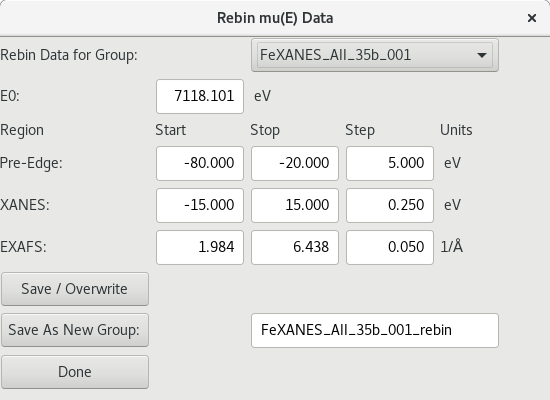
Figure 5.4.5.1 Energy re-binning dialog.
5.4.6. Correcting for Over-Absorption in XAS Data
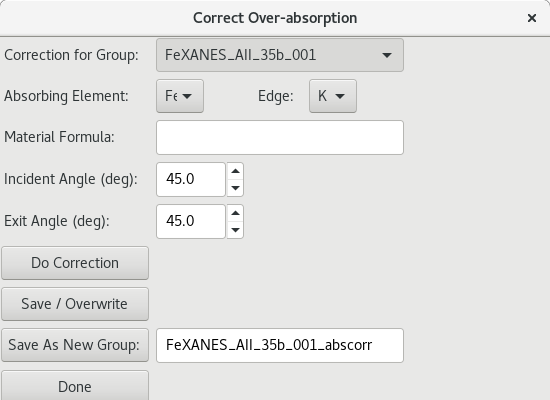
Figure 5.4.6.1 Over-absorption correction dialog
