Note
Click here to download the full example code
Fit with Algebraic Constraint

Out:
[[Fit Statistics]]
    # fitting method   = leastsq
    # function evals   = 53
    # data points      = 601
    # variables        = 6
    chi-square         = 71878.3055
    reduced chi-square = 120.803875
    Akaike info crit   = 2887.26503
    Bayesian info crit = 2913.65660
[[Variables]]
    amp_g:       21.1877704 +/- 0.32191824 (1.52%) (init = 10)
    cen_g:       8.11125923 +/- 0.01162984 (0.14%) (init = 9)
    wid_g:       1.20925846 +/- 0.01170853 (0.97%) (init = 1)
    amp_tot:     30.6003738 +/- 0.36481391 (1.19%) (init = 20)
    amp_l:       9.41260340 +/- 0.61672681 (6.55%) == 'amp_tot - amp_g'
    cen_l:       9.61125923 +/- 0.01162984 (0.12%) == '1.5+cen_g'
    wid_l:       2.41851692 +/- 0.02341706 (0.97%) == '2*wid_g'
    line_slope:  0.49615727 +/- 0.00170178 (0.34%) (init = 0)
    line_off:    0.04128591 +/- 0.02448064 (59.30%) (init = 0)
[[Correlations]] (unreported correlations are < 0.100)
    C(amp_g, wid_g)         =  0.866
    C(amp_g, cen_g)         =  0.750
    C(line_slope, line_off) = -0.714
    C(cen_g, amp_tot)       = -0.695
    C(cen_g, wid_g)         =  0.623
    C(amp_g, amp_tot)       = -0.612
    C(amp_tot, line_off)    = -0.588
    C(wid_g, amp_tot)       = -0.412
    C(cen_g, line_off)      =  0.387
    C(amp_g, line_off)      =  0.183
    C(amp_g, line_slope)    =  0.183
    C(wid_g, line_slope)    =  0.174
/Users/Newville/Codes/lmfit-py/examples/example_fit_with_algebraic_constraint.py:66: UserWarning: Matplotlib is currently using agg, which is a non-GUI backend, so cannot show the figure.
  plt.show()
import matplotlib.pyplot as plt
from numpy import linspace, random

from lmfit import Minimizer, Parameters
from lmfit.lineshapes import gaussian, lorentzian
from lmfit.printfuncs import report_fit


def residual(pars, x, sigma=None, data=None):
    yg = gaussian(x, pars['amp_g'], pars['cen_g'], pars['wid_g'])
    yl = lorentzian(x, pars['amp_l'], pars['cen_l'], pars['wid_l'])

    slope = pars['line_slope']
    offset = pars['line_off']
    model = yg + yl + offset + x*slope

    if data is None:
        return model
    if sigma is None:
        return model - data
    return (model - data) / sigma


random.seed(0)
x = linspace(0.0, 20.0, 601)

data = (gaussian(x, 21, 8.1, 1.2) +
        lorentzian(x, 10, 9.6, 2.4) +
        random.normal(scale=0.23, size=x.size) +
        x*0.5)


pfit = Parameters()
pfit.add(name='amp_g', value=10)
pfit.add(name='cen_g', value=9)
pfit.add(name='wid_g', value=1)
pfit.add(name='amp_tot', value=20)
pfit.add(name='amp_l', expr='amp_tot - amp_g')
pfit.add(name='cen_l', expr='1.5+cen_g')
pfit.add(name='wid_l', expr='2*wid_g')
pfit.add(name='line_slope', value=0.0)
pfit.add(name='line_off', value=0.0)

sigma = 0.021  # estimate of data error (for all data points)

myfit = Minimizer(residual, pfit,
                  fcn_args=(x,), fcn_kws={'sigma': sigma, 'data': data},
                  scale_covar=True)

result = myfit.leastsq()
init = residual(pfit, x)
fit = residual(result.params, x)

report_fit(result)

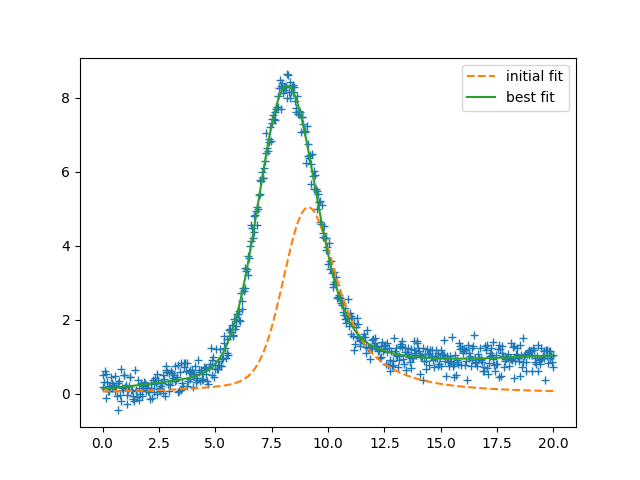
plt.plot(x, data, 'r+')
plt.plot(x, init, 'b--', label='initial fit')
plt.plot(x, fit, 'k-', label='best fit')
plt.legend(loc='best')
plt.show()
Total running time of the script: ( 0 minutes 0.103 seconds)