Note
Click here to download the full example code
doc_builtinmodels_nistgauss.py

Out:
[[Model]]
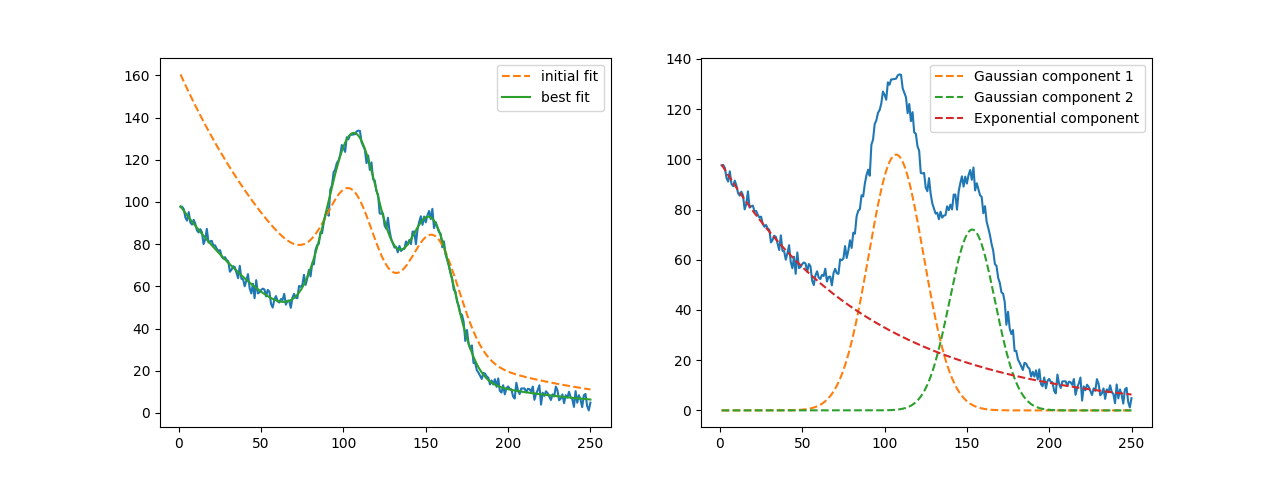
    ((Model(gaussian, prefix='g1_') + Model(gaussian, prefix='g2_')) + Model(exponential, prefix='exp_'))
[[Fit Statistics]]
    # fitting method   = leastsq
    # function evals   = 46
    # data points      = 250
    # variables        = 8
    chi-square         = 1247.52821
    reduced chi-square = 5.15507524
    Akaike info crit   = 417.864631
    Bayesian info crit = 446.036318
[[Variables]]
    exp_amplitude:  99.0183282 +/- 0.53748735 (0.54%) (init = 162.2102)
    exp_decay:      90.9508861 +/- 1.10310509 (1.21%) (init = 93.24905)
    g1_amplitude:   4257.77318 +/- 42.3833640 (1.00%) (init = 2000)
    g1_center:      107.030954 +/- 0.15006784 (0.14%) (init = 105)
    g1_sigma:       16.6725753 +/- 0.16048161 (0.96%) (init = 15)
    g1_fwhm:        39.2609138 +/- 0.37790530 (0.96%) == '2.3548200*g1_sigma'
    g1_height:      101.880231 +/- 0.59217099 (0.58%) == '0.3989423*g1_amplitude/max(2.220446049250313e-16, g1_sigma)'
    g2_amplitude:   2493.41771 +/- 36.1694729 (1.45%) (init = 2000)
    g2_center:      153.270100 +/- 0.19466742 (0.13%) (init = 155)
    g2_sigma:       13.8069484 +/- 0.18679415 (1.35%) (init = 15)
    g2_fwhm:        32.5128783 +/- 0.43986659 (1.35%) == '2.3548200*g2_sigma'
    g2_height:      72.0455934 +/- 0.61722093 (0.86%) == '0.3989423*g2_amplitude/max(2.220446049250313e-16, g2_sigma)'
[[Correlations]] (unreported correlations are < 0.500)
    C(g1_amplitude, g1_sigma)   =  0.824
    C(g2_amplitude, g2_sigma)   =  0.815
    C(exp_amplitude, exp_decay) = -0.695
    C(g1_sigma, g2_center)      =  0.684
    C(g1_center, g2_amplitude)  = -0.669
    C(g1_center, g2_sigma)      = -0.652
    C(g1_amplitude, g2_center)  =  0.648
    C(g1_center, g2_center)     =  0.621
    C(g1_center, g1_sigma)      =  0.507
    C(exp_decay, g1_amplitude)  = -0.507
##
import warnings
warnings.filterwarnings("ignore")
##
# <examples/doc_builtinmodels_nistgauss.py>
import matplotlib.pyplot as plt
import numpy as np

from lmfit.models import ExponentialModel, GaussianModel

dat = np.loadtxt('NIST_Gauss2.dat')
x = dat[:, 1]
y = dat[:, 0]

exp_mod = ExponentialModel(prefix='exp_')
pars = exp_mod.guess(y, x=x)

gauss1 = GaussianModel(prefix='g1_')
pars.update(gauss1.make_params())

pars['g1_center'].set(value=105, min=75, max=125)
pars['g1_sigma'].set(value=15, min=3)
pars['g1_amplitude'].set(value=2000, min=10)

gauss2 = GaussianModel(prefix='g2_')
pars.update(gauss2.make_params())

pars['g2_center'].set(value=155, min=125, max=175)
pars['g2_sigma'].set(value=15, min=3)
pars['g2_amplitude'].set(value=2000, min=10)

mod = gauss1 + gauss2 + exp_mod

init = mod.eval(pars, x=x)
out = mod.fit(y, pars, x=x)

print(out.fit_report(min_correl=0.5))

fig, axes = plt.subplots(1, 2, figsize=(12.8, 4.8))
axes[0].plot(x, y, 'b')
axes[0].plot(x, init, 'k--', label='initial fit')
axes[0].plot(x, out.best_fit, 'r-', label='best fit')
axes[0].legend(loc='best')

comps = out.eval_components(x=x)
axes[1].plot(x, y, 'b')
axes[1].plot(x, comps['g1_'], 'g--', label='Gaussian component 1')
axes[1].plot(x, comps['g2_'], 'm--', label='Gaussian component 2')
axes[1].plot(x, comps['exp_'], 'k--', label='Exponential component')
axes[1].legend(loc='best')

plt.show()
# <end examples/doc_builtinmodels_nistgauss.py>
Total running time of the script: ( 0 minutes 0.227 seconds)