2.1 MCA Wedget
Overview
Tony Lanzirotti has written a nice document about this for X26 beamline at NSLS.† His webpage can be found here.† The following is modified from his work (Thanks, Tony!).
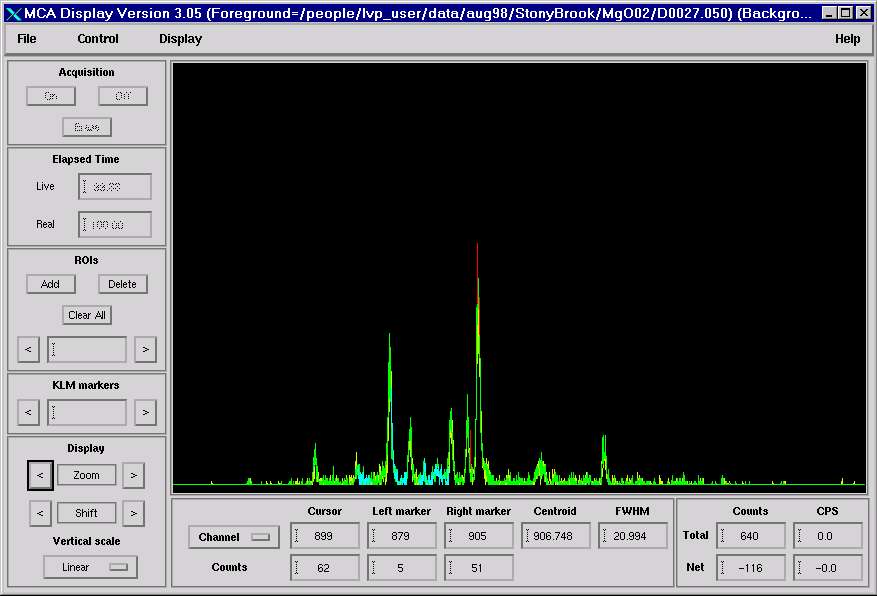
The MCA wedget is divided into seven sections, besides the display of the sepctrum.† The top menu bar section contains operational functions such as saving and printing spectra (File), data collection time set up and calibration functions (Controls), peak markers, scaling, and peak fitting (Display), as well as Help.† Click on the links to see details. †Here, letís only look at the other six sections.

2.1.1 Acquisition
and Elapsed Time Sections
The Acquisition section allows us to turn the data acquisition "On" or "Off", and "Erase" clears the spectra that's being displayed in the window. The Elapsed Time section gives us a digital reading of the elapsed "Real Time" and "Live Time". ††
2.1.2 ROIs
Section
The ROIs section allows you to "Add", "Delete", or "Clear All" defined ROI's. The window also allows you to cycle through any ROI's that are defined. To add an ROI follow these steps: 1) find a peak of interest in the display window and decide where you'd like to define the low and high energy limits of the peak. 2) Left-click with the mouse on the left side of the peak and then middle-click with the mouse (the middle roller bar on a Microsoft Intellimouse) to define this position. This defines the left side. 3) Left-Click on the right side of the peak and then right-click with the mouse to define the high energy side of the ROI. 4) Go to the text window and type in what you want to label this ROI. In this example we typed "Fe Ka" to define the Fe K-alpha peak as an ROI. 5) Click on the "Add" button to define the ROI. You should now see the ROI highlighted in blue on the spectrum. The above display has a few ROIs defined as blue (or cyan), and also has an over lap spectrum displayed in green.† Check the section on File for overlapping plot.
Once you've defined several ROIs the "<" and ">"
symbols on either side of the text box will cycle through each ROI, with two
red vertical lines being displayed on each side of the ROI in the display
window to show which ROI is selected. Once selected in this manner you can use "Delete" to erase the ROI or look at the
bottom of the widget screen to see how many counts have been collected on that
peak and the rate at which counts are being accumulated in counts per second
(CPS). The really neat thing about this being integrated into the IDL routines
now and using MEDM is that any ROI's that are defined here are immediately
passed on as variables to any other IDL routines you may run and in fact to the
MEDM graphical displays as well. So if you now open up the MEDM version of the
MCA display you should now see the same ROIs already defined for you. Also, when
you start setting up an IDL scan you'll also now find that all the ROI's are
pre-defined for you...so you don't have to enter all these values yourself and
if you decide to add an ROI on the fly, the IDL scan routines are immediately
updated. You should now be able to define up to 32 ROI's.
2.1.3 KLM Markers Section
The KLM Markers section allows you to look at energy calibration information for the spectrum displayed. For example, if you want to see where the Fe fluorescence lines are type "Fe Ka" in the text box and hit <ENTER>. You'll notice the text box change to display "Fe Ka1, b1" informing you that data is being shown for the Fe K-alpha1 and K-beta1 peaks and you'll see two vertical red lines displayed on the XRF spectra corresponding to the energies of those two peaks. If you press the "<" or ">" buttons on either side of the text box the widget will display fluorescence lines for elements of decreasing or increasing atomic number respectively.
2.1.4 Display Section
The Display section allows you to change the physical appearance of the XRF spectra being displayed. To zoom in on a portion of the spectra left-click with the mouse on the section of interest and press the "<" or ">" buttons on either side of the word "Zoom" to zoom out or zoom in respectively. To slide the displayed spectra right or left once you've zoomed in follow the same procedure but press the buttons on either side of the word "Shift". You can also change the "Vertical scale" of the plot to be either "Linear" or "Logarithmic" using the drop down list in this section.
2.1.5 Channel Information
Along the bottom of the widget are a series of windows that provide
information about a particular selected portion of the XRF spectra displayed.
Here you'll find a drop down list that allows you to change the units of any
information displayed to be in terms of "Channel"
number, "Energy" (in KeV), or "d-spacing". Once a particular unit is
selected the next series of windows show where the cursor is sitting, where the
left and right markers of a selected ROI are located, and what the centroid and
FWHM of that ROI are (all in the units you selected from the drop-down list). †To the right you'll also find digital readouts
of the total and net
Counts and CPS for that selected area.