
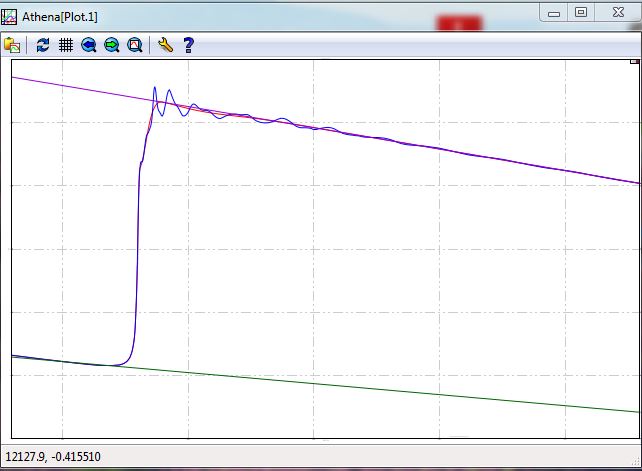
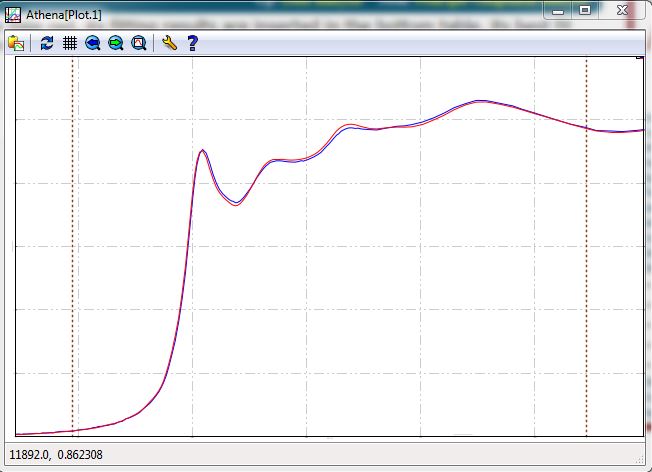
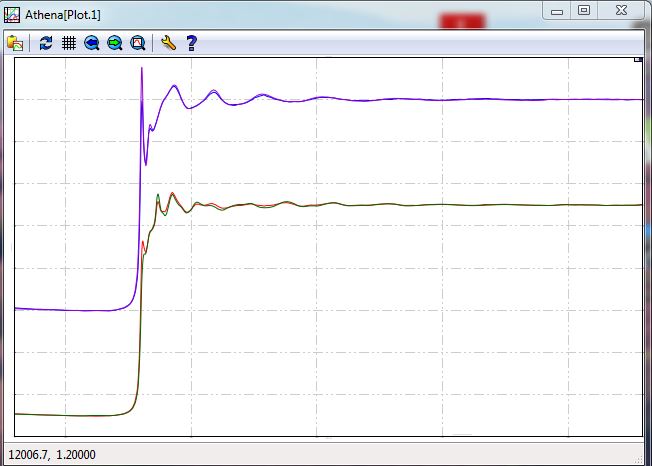
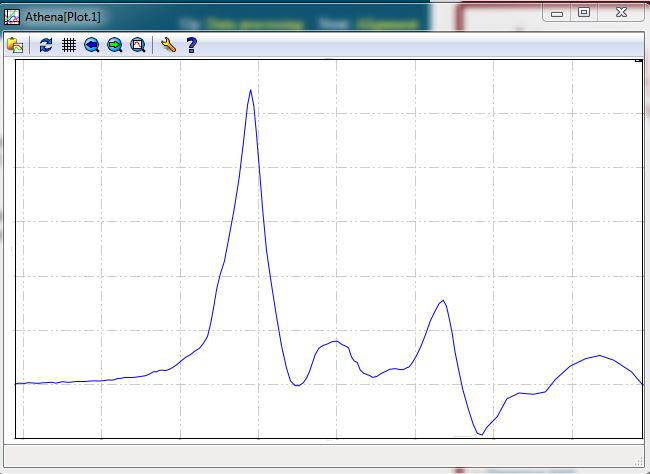
I have run another example file (Au+Cyanobacteria) downloaded from https://github.com/bruceravel/XAS-Education in Athena 0.9.24 under Windows 7 64 bit using two different Dell computers and observed the following apparent bugs: In both computers the orange points that indicates the E0 and the limits of pre and post-edge fittings did not appear in the plots; In both computers the legends did not appear in all plots; the same for the axes's scales and titles. The LCF plot showed just the sample and the fitted normalized ones even when the standard ones were required; In one computer, there were just two choice options for the standards; in the other one these boxes worked normally and all standards could be considered. Some screenshots are attached to this message, Marcelo.