
\(\newcommand{\AA}{\unicode{x212B}}\)
4. Other Larch GUIs
In addition to Larix, Larch provides a few other Graphical User Interfaces for manipulating, viewing, and processing of X-ray spectroscopy, scattering, and imaging data. Many of the GUI displays are interrelated, so that they can bring up the other windows for displaying, interacting, and processing data. These include
Larch_XRF: A GUI for displaying and analyzing X-ray fluorescence spectra.
Larch_XRD1D: A GUI for displaying and analyzing X-ray Diffraction patterns, integrating XRD images to 1D XRD patterns, and comparing 1D XRD patterns to known crystal structures from CIF files.
GSE_Mapviewer: visualization and Analysis of XRF and XRD maps.
larch_gui: simple command-line + data browser for Larch. This is used by other Larch GUIs as the command-line buffer, and can be used to interact with all the raw data within the application.
4.1. Larch Command-Line Application
The basic larch program gives a simple shell interface to an interactive Larch session, using the Larch macro language. With it you can read, visualize, and manipulate data and run any of the Larch functions to process, analyze, and plot data.
4.2. Basic Larch GUI
The simplest Graphical Interface to Larch provides a basic interactive Larch session, showing data and methods and commands using the Larch DSL entered into the session.
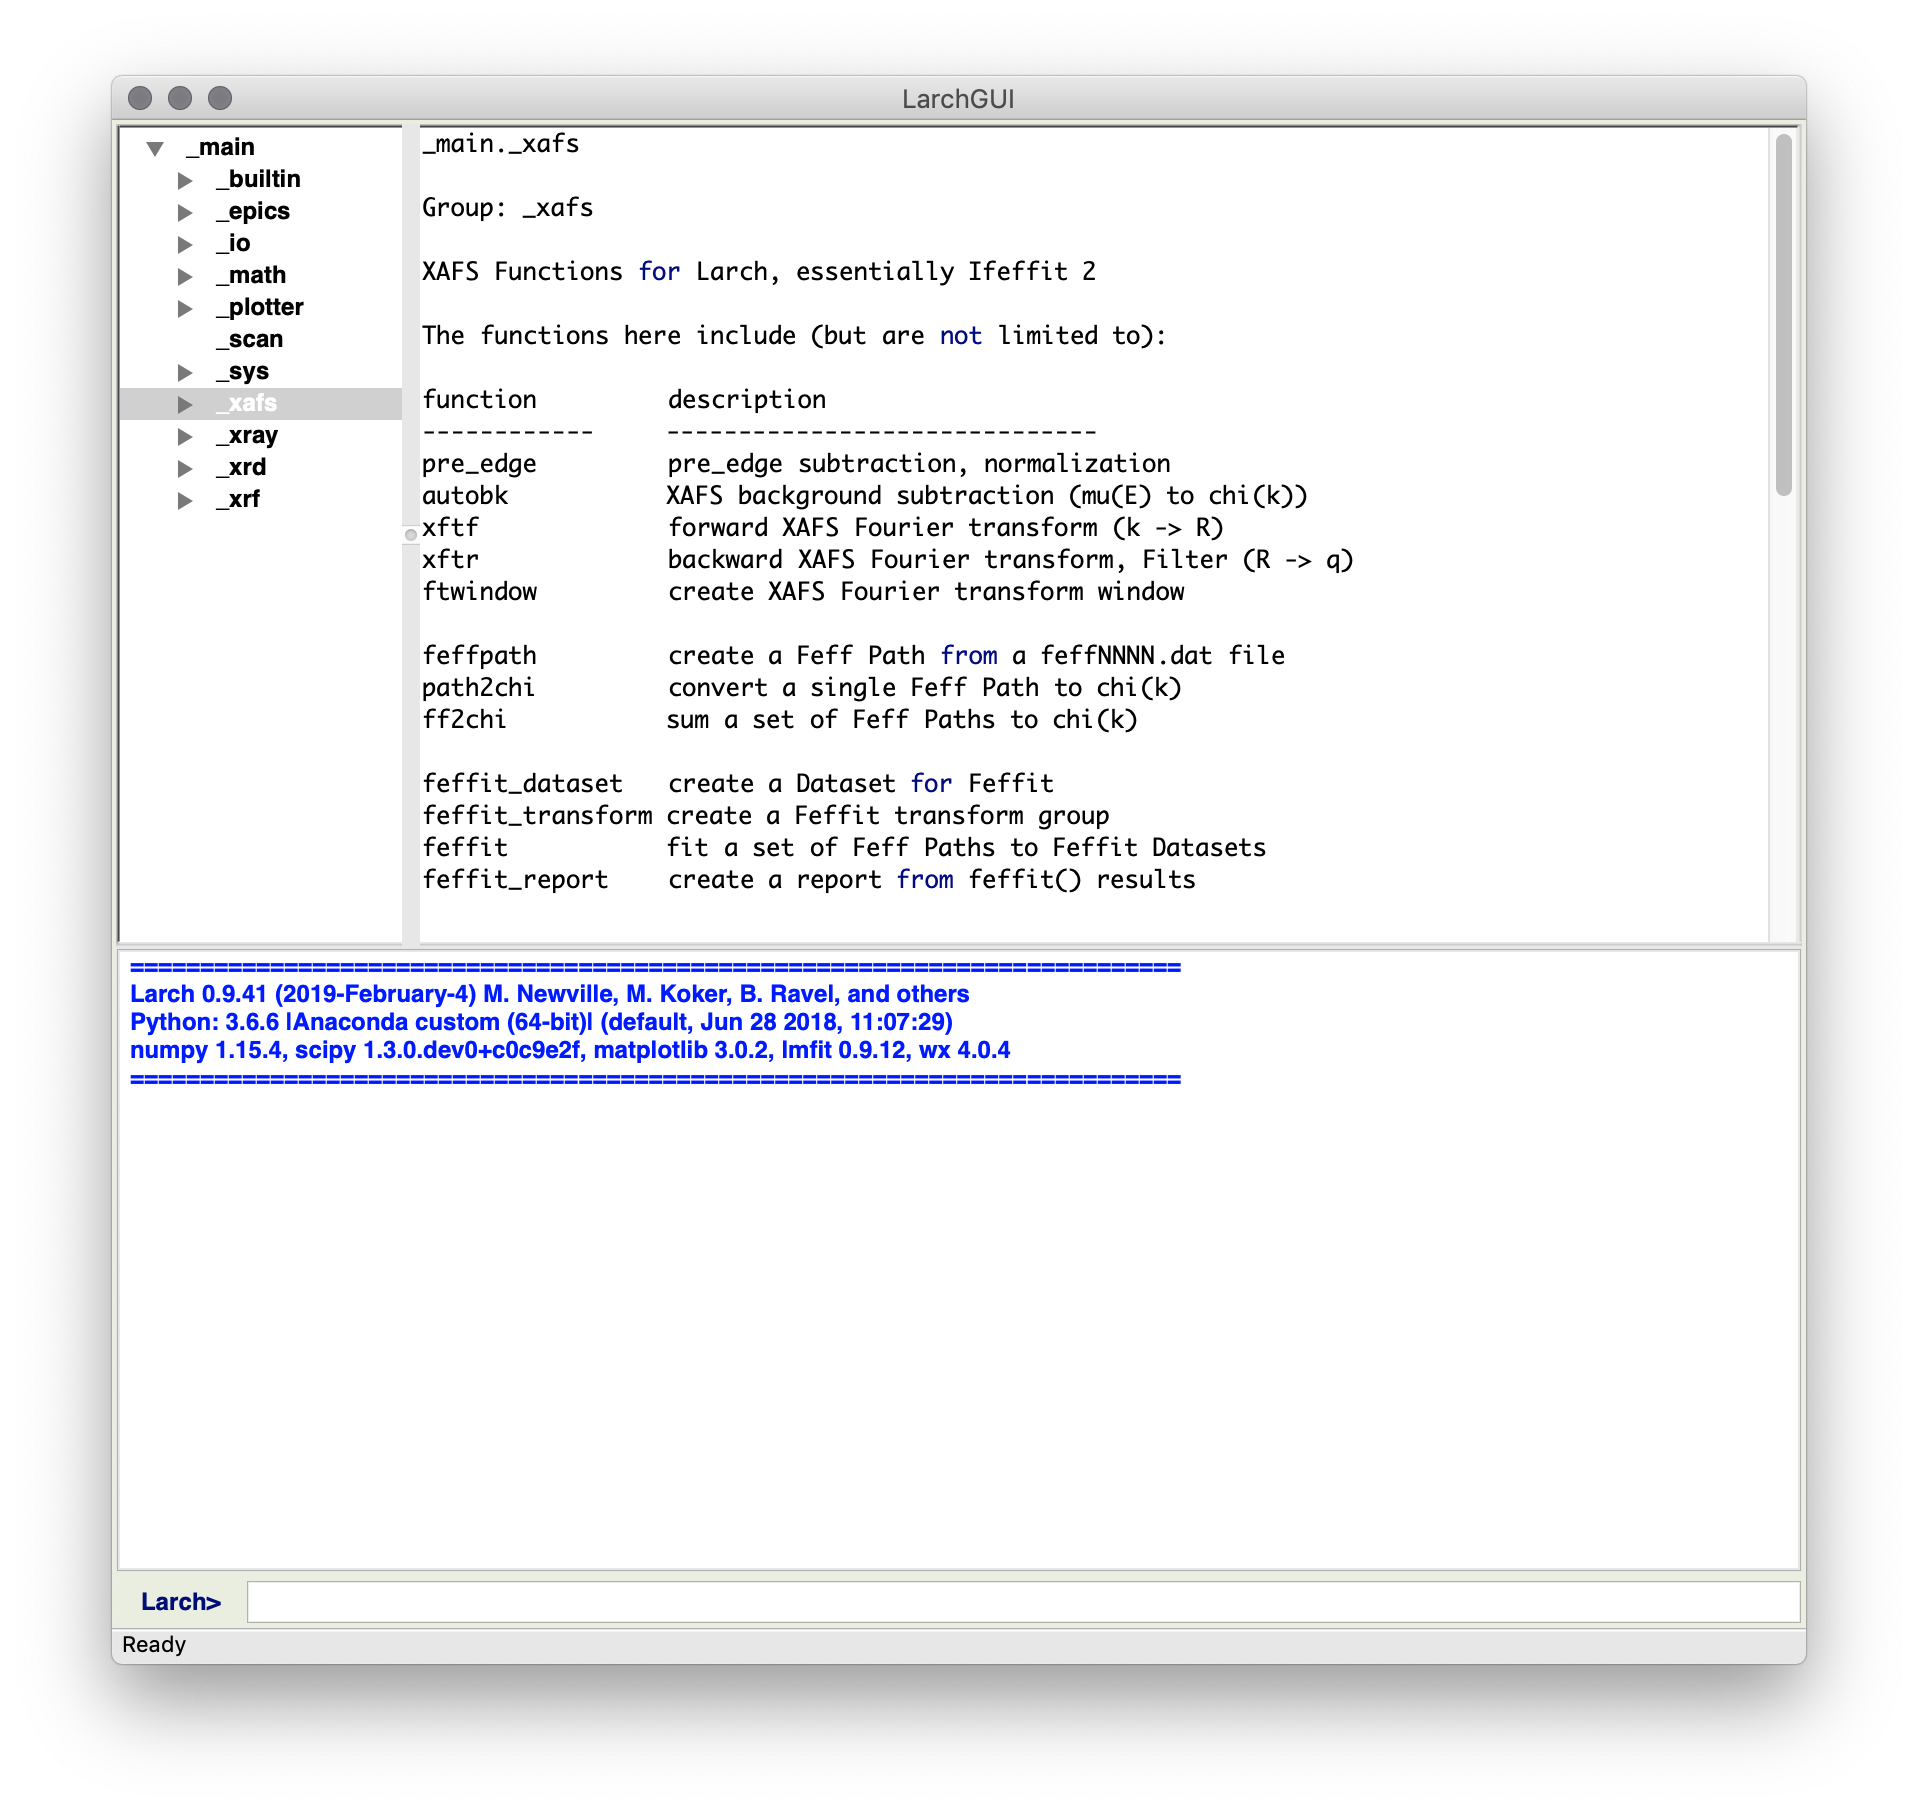
Figure 4.2.1 Basic Larch Ehanced Shell GUI
This Graphical Interface in Figure 4.2.1 shows a command-line interface at the bottom of the screen. In this window, you can copy or type Larch commands – that is commands in the Larch language. When you hit Enter or Return, the command will be executed. The history of the commands and any outputs written by the command will be displayed in the output panel taking up most of the bottom half of the main window. The top part of the window shows a Data Browser which allows you to browse through the various groups for modules and datasets, and examine their contents and view function documentation and so on.
This Graphical User Interface is deliberately basic, giving a low-level
interface to Larch commands and data, and is mainly intended for scripting
analysis and debugging. From the File Menu you can read in data from text
column files (using one of _io.read_ascii(), _io.read_xdi(), or
_io.read_gsexdi() as appropriate) or from Athena Project files (using
_io.read_athena() and _io.extract_athenagroup()). You can also
load and run a text file of commands or save the commands run in a session
to a file.
The main Larch GUI also provides simple launchers for several of the main Larch Applications, including Larix.
From the Larch GUI, one can browse and act on data. This includes the ability make Simple plot of 1-D data, using wxmplot. This wraps matplotlib, and gives a fully interactive with point selection, rubber-band zoom, and a configuration frame (right) for the user to select colors and line properties, and so forth.
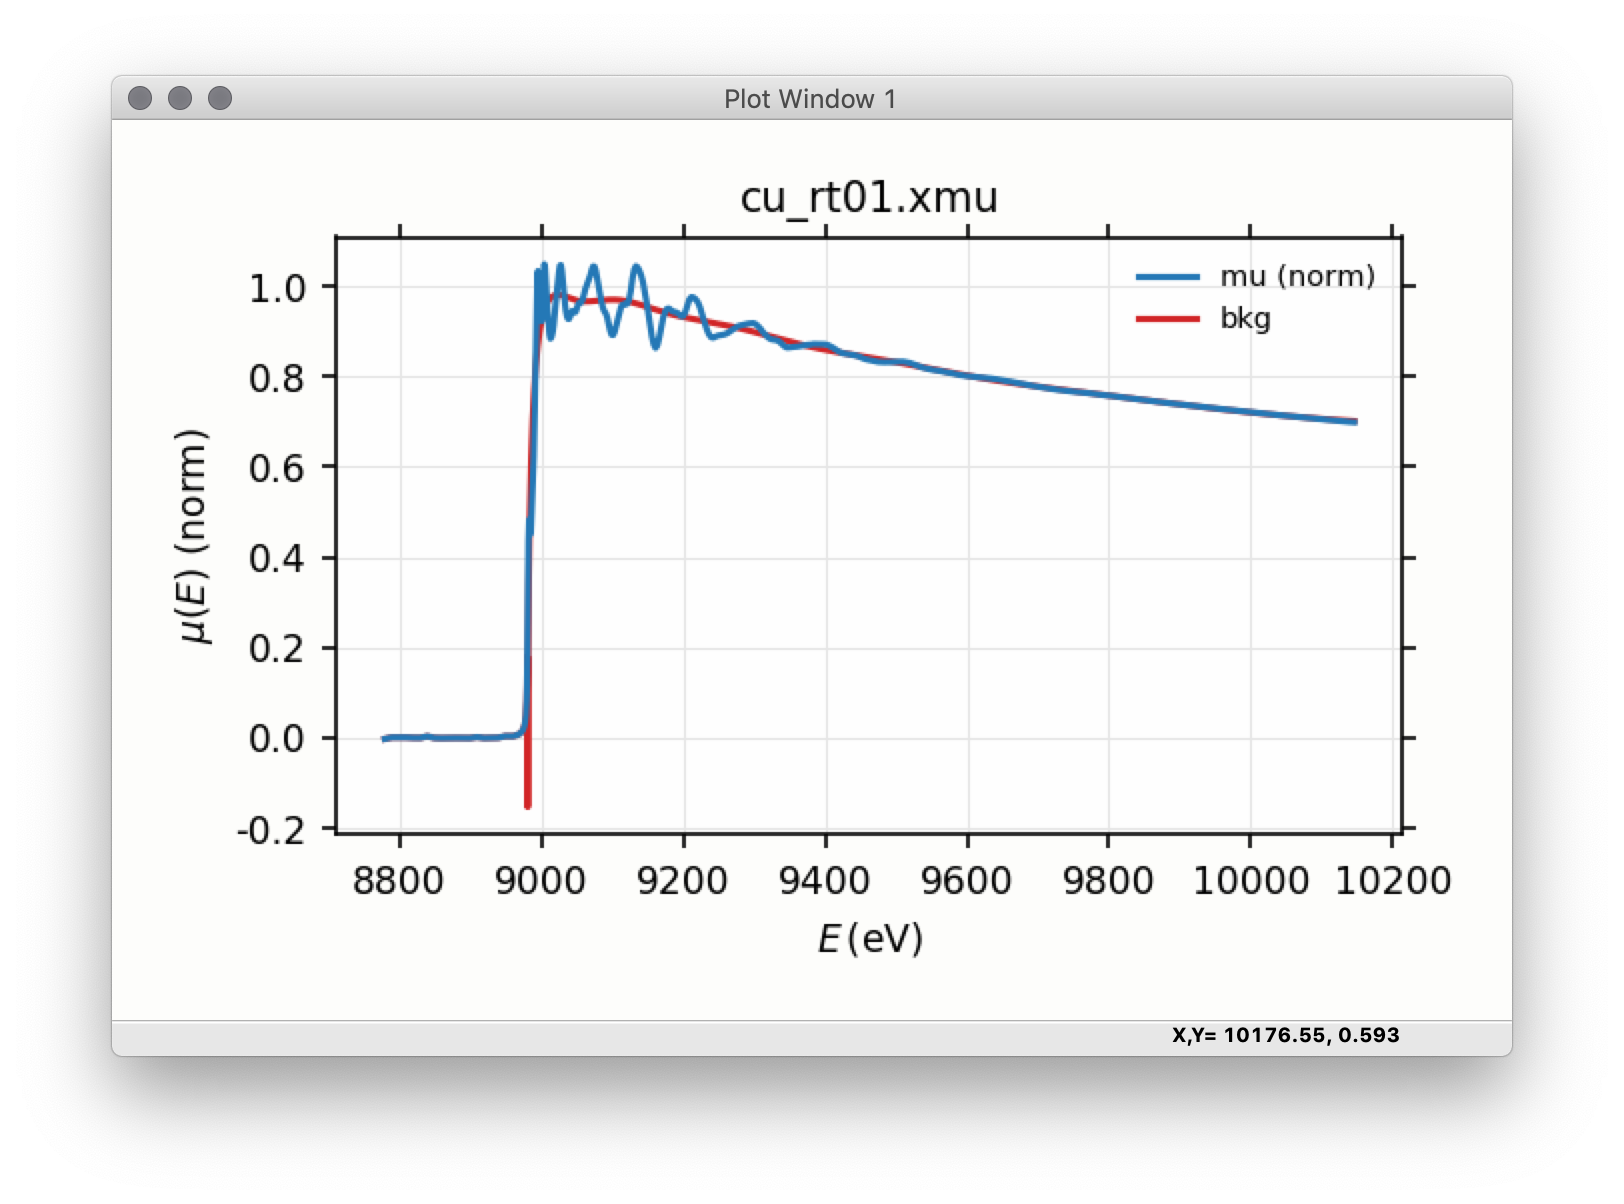
Figure 4.2.2 Basic Plot
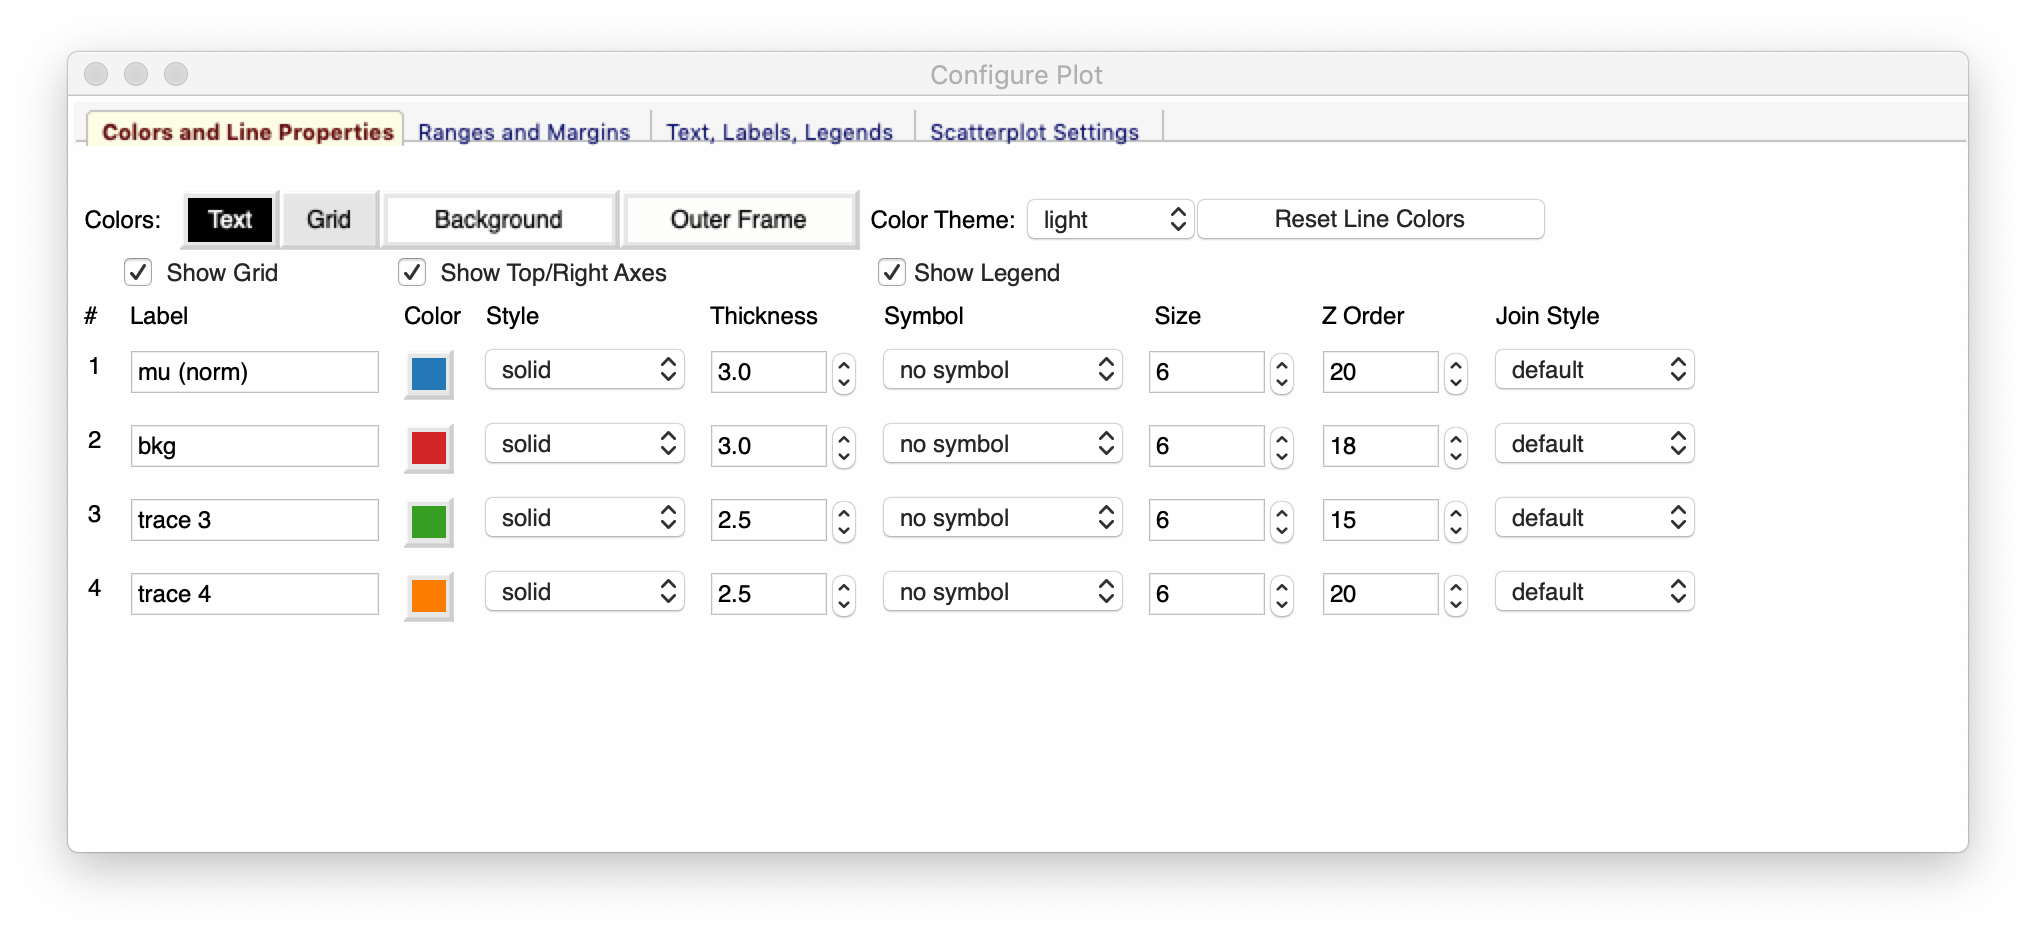
Figure 4.2.3 Plot Configuration Window
Example plots and plot configuration.