|
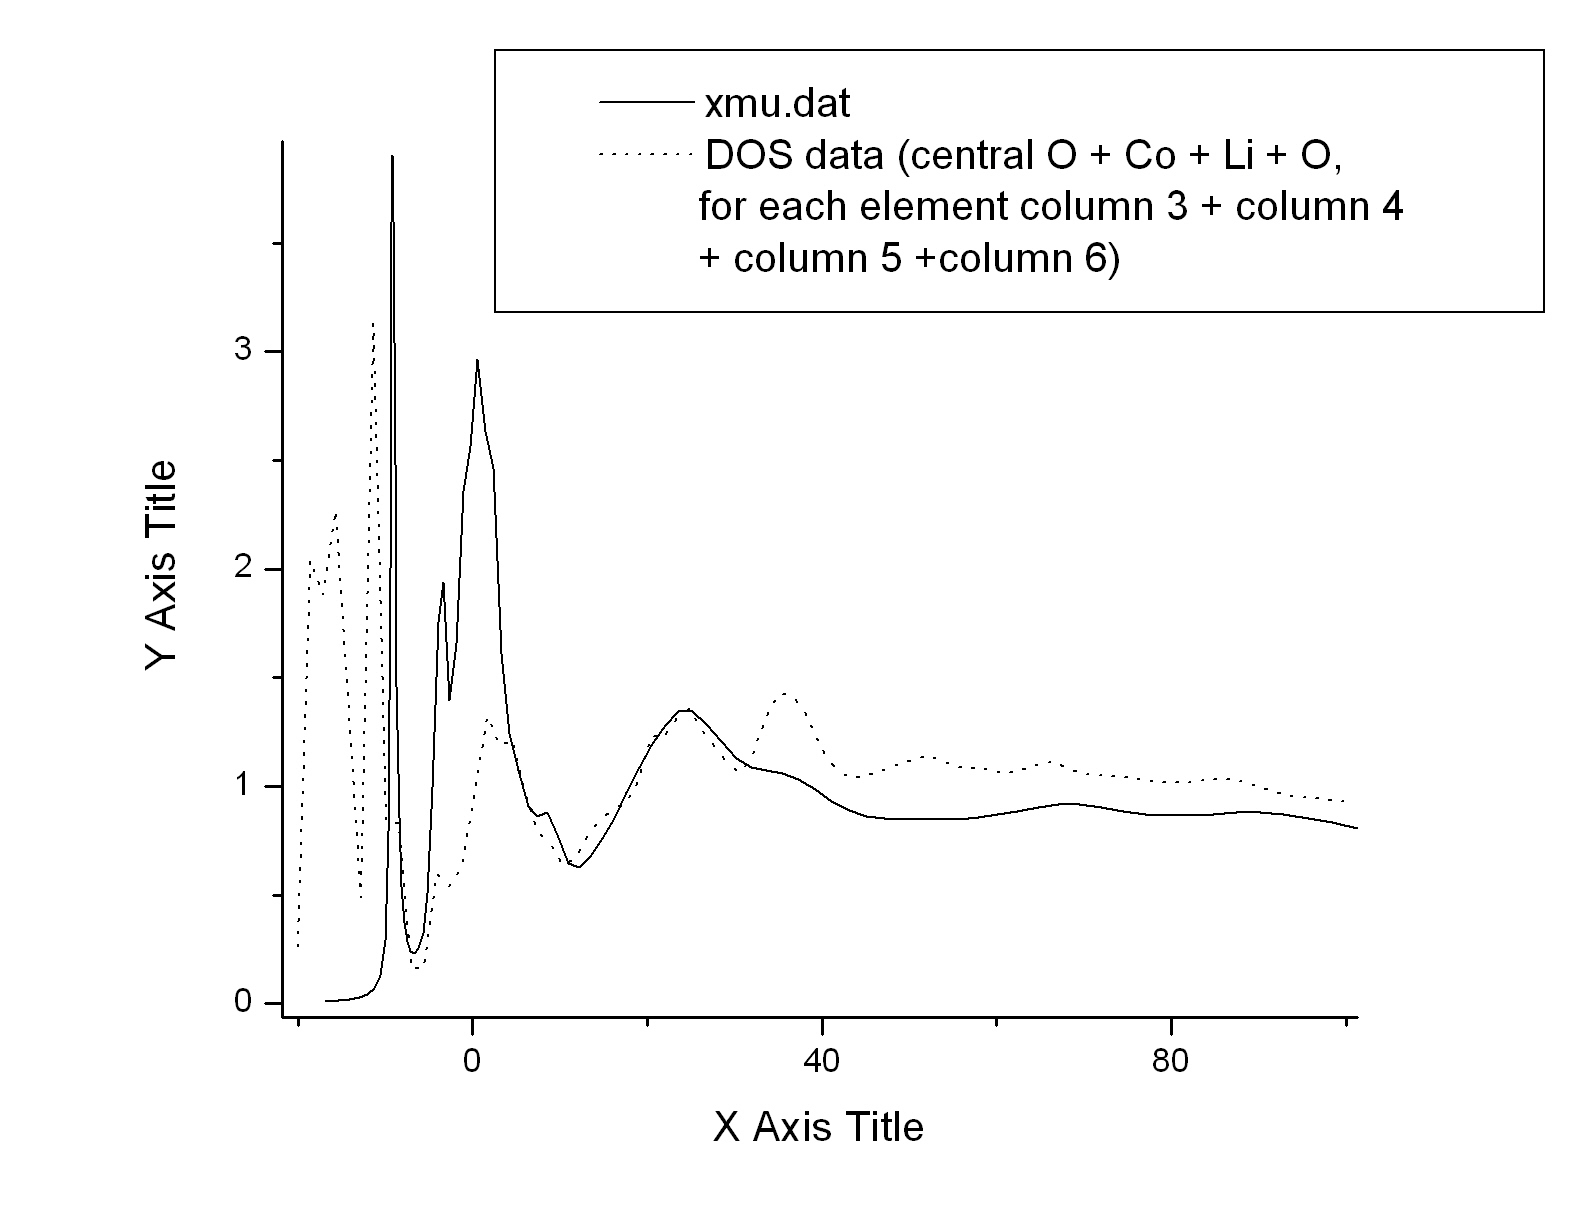
Dear Mr. Rehr, I have plotted together the spectroscopic data (xmu.dat file) and the local densities of states data (rholNN.dat files) using your answer to my original question. There is one rholNN.dat file written for each entry on the POTENTIALS list, and each file has 4 columns of LDOS data. To obtain the total DOS data I have plotted I summed the 4 columns in each rhol.dat file and summed that data from all rhol.dat files. The result is plotted in the attached file. While the match is far from perfect, for most of the peaks there is at least a correlation in position, and for one (at ~ 25eV) also in amplitude. However that is not the case with the main, highest peak (at ~ 10 eV). There is nothing in the local DOS that would explain it, save to a peak to the left (at ~ 11 eV). I was wondering if you might guide me in the right direction. Thank you, Lydia Nemirovsky |